Selling My Home
Great Deals
Property Search
Foreclosures
Income Property
New Construction
Downtown
Neighborhoods
Condos
Rentals
Investor Central
Real Estate Blogs
Resources
Testimonials
Webcams
Client Log-in
Contact Us
Fort Lauderdale Real Estate Investments
A unique and dynamic market
Fortunes are made here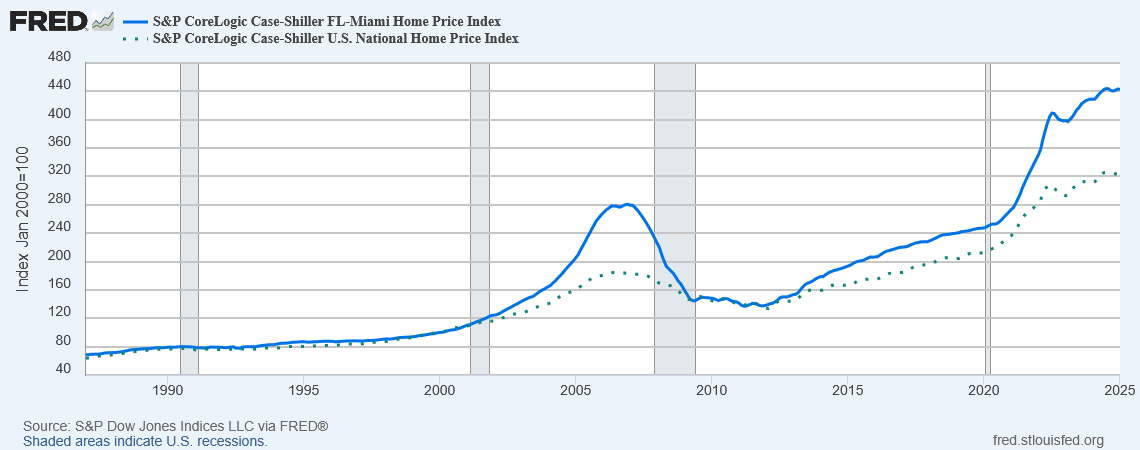
Blue Line is the latest S&P Case-Shiller Home Price Index for South Florida Metro Reporting Area
(Miami-Dade, Broward and Palm Beach Counties)
Dotted Line is the Home Price Index for the U.S.
Shaded Areas on Chart represent U.S. Recessions
CONDOS
OK to Lease 1st Year
Residential Income Property
Duplex, Triplex, Fourplex & More!
Ft Lauderdale Real Estate News 9/22/2023
Fort Lauderdale Home Prices Show Appreciation of 14.3%
You Call That a "Down" Year?
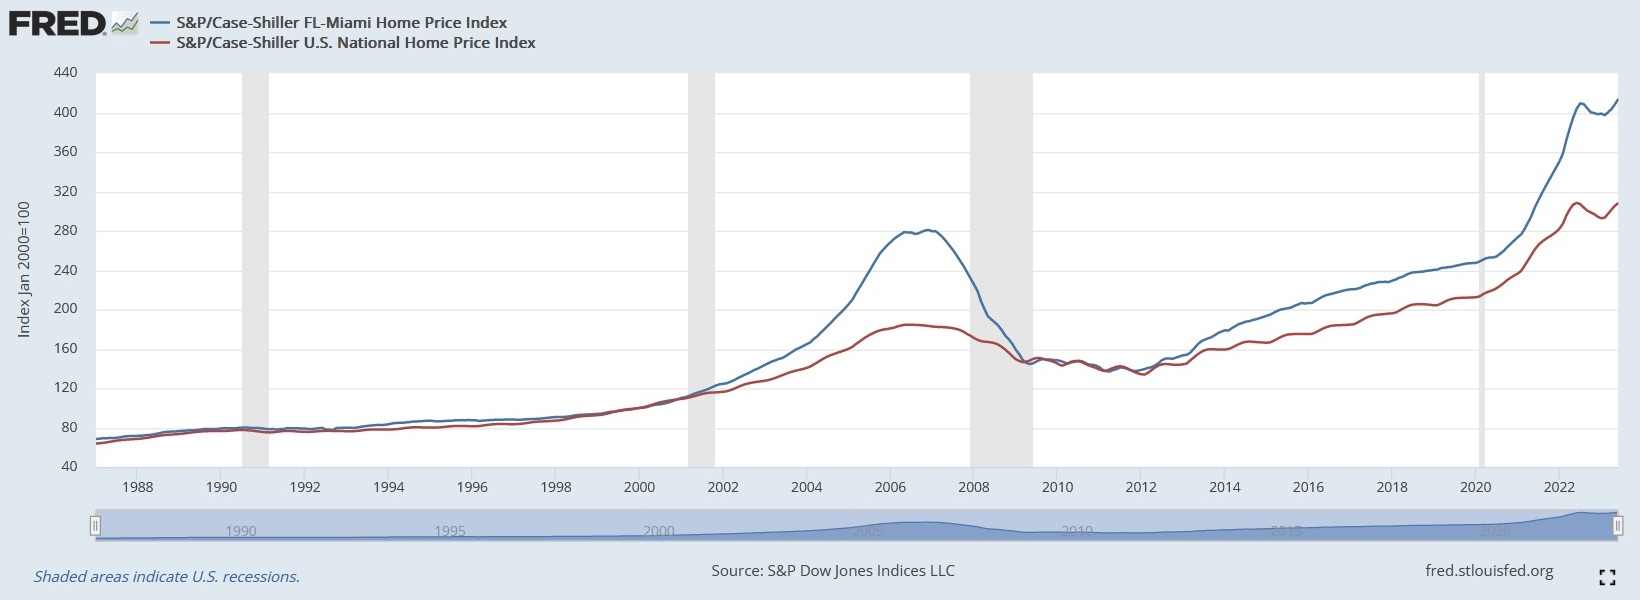
Blue Line is S&P Case-Shiller Home Price Index for South Florida Metro Reporting Area
(Miami-Dade, Broward and Palm Beach Counties) from 1987 thru May, 2023
Red Line is the Home Price Index for the U.S.
Shaded Areas on Chart represent U.S. Recessions
Following a staggering rise of 36.2% in 2021, and 18.9% in 2020, the Real Estate Market in Fort Lauderdale was supposed to take a bit of a breather. And we suppose you could say it did. According to 2022 Year End statistics released by Florida Realtors, data generated by compiling sales reported through the MLS of local realtor associations throughout the Sunshine State, the Average Sale Price for a Single Family Home in the city of Fort Lauderdale only rose 14.3%.
Yes. ONLY 14.3%.
Which raises two interesting questions:
The first – what kind of Real Estate Market are you in when 14.3% appreciation is considered a "down" year?
The second – why is anybody investing in Real Estate anywhere else?
With mortgage rates high and inventory tight, following two years of explosive growth, you would expect Real Estate to cool off, consolidate, as people became accustomed to the new pricing reality.
Apparently, in Fort Lauderdale, that translates to 14.3%.
An even more telling stat, perhaps, is the "Median Percent of Original List Price Received," which calculates the spread between asking and closing price. Historically, the Median Percentage of List Price Received for a Single Family Home in Broward County has been around 95-96% of the property's asking, with Condominiums and Townhomes around 94-95%. In 2022 the Median Percent of List Price received for a Single Family Home was 100% and 99.1% for Condos and Townhomes.
This is a Median statistic, remember. That means of the 14,438 sales of Single Family Homes in Broward County in 2022, at least half of those were higher than full asking price.
For those of you keeping score at home, that's two years in a row the Median Percent of Listing Price Received in Broward County has been 100%.
What The Heck Is Net Domestic Migration?
A few months ago we reported interesting numbers released in an analysis of U.S. Census Bureau data by the National Association of Realtors concerning Net Domestic Migration. This is a fancy way of saying Who's Moving Where From to Where?
According to this study, tracking the percentage of inbound moves between 2019 and 2022 more people were relocating to the South Florida reporting area (Miami-Dade, Broward and Palm Beach Counties) than any other metro in the country.
Aside from the weather (you never have to shovel sunshine out of your driveway) the main contributors to this influx of homeowners was undoubtedly Covid-19 and Taxes.
Once the Pandemic hit, many – especially in Finance thru the Northeast – began working remotely, wondered how smart it was to pay millions for a 900 sq. ft. co-op in a sub-arctic urban shithole when for equal money they could live in a luxury waterfront pool home in a tropical paradise.
In addition, California raised their State Income Tax to 16% to pay for cleaning streets where the homeless people go to the bathroom. We have a good friend, saw our blog, corrected us, claiming California only raised the State Income Tax to 13%. A tremendous consolation. Perhaps the local government should post that on billboards heading east, right before the Arizona state line, see how much difference that makes.
If you want to read our post concerning Net Domesticate Migration, click the link below.
Net Domestic Migration
Land of No Land
The old adage of "they're not making any more" has never applied more appropriately than it does to Fort Lauderdale. Broward County is not large, less than 30 miles north to south, and though it technically stretches halfway across the Floridian peninsula, around 45 miles, almost two thirds of it is comprised of wetlands, which is it's source of fresh water. In all Broward County there is only 471 square miles of developable dry land, and at this point it is fully developed.
The last large chunk of undeveloped land left in Broward, 61 (Everglades adjacent) acres by the corner of US-27 and Sheridan Street, was purchased by Amazon in 2021.
As a result, more and more people are moving into a location where there is no more empty land upon which to build. So this is not a "bubble." Barring cataclysmic natural disasters, asteroid impacts and/or total collapse of Western economies, it is all but impossible to envision housing prices ever retreating in Southeast Florida, particularly Broward County.
Back to Numbers
Year End 2022 stats show strength throughout Florida.
In Single Family, the Median Price increased 15.7% from $348,000 in 2021 to $402,500 in 2022, while the Average Sale Price went from $505,129 in 2021 to $562,442 in 2022, a gain of 11.3%.
Closed Sales, however, were down 18% from 350,516 in 2021 to 287,352 in 2022. This is undoubtedly another factor contributing to the rise in property values. In addition to, and possibly due to, the Median Percentage of List Price Received for the entire state of Florida was 100%.
In the South Florida reporting metro (Miami-Dade, Broward and Palm Beach Counties) the Median Price for a Single Family Home increased 17% from $265,000 in 2021 to $310,000 in 2022. Average Sale Price was up 13.9% from $446,100 in 2021 to $508,001 in 2022. Again, Closed Sales declined significantly, from 63,499 in 2021 to 51,232 in 2022, down 19.3%, while the Median Percentage of List Price Received went up from 96.7% to 98.5%.
Broward County, a more desirable location than Miami-Dade or Palm Beach, reported better stats than statewide or the South Florida reporting area. Median Price for Single Family homes rose 17% from $470,000 in 2021 to $550,000 in 2022. Average Sale Price increased 14.2% from $668,533 in 2021 to $763,768 in 2022.
Closed Sales declined 22.2% from 18,565 to 14,438, year over year, and Median Percentage of List Price Received remained at 100% for 2022.
As we cited previously, the Average Sale Price for a Single Family Residence in the city of Fort Lauderdale showed an increase of 14.3%, with Closed Sales registering a steep decline of 30% year over year. Drilling a little deeper we can see more affluent neighborhoods outperformed the County average. Zip Code 33301 (the Las Olas Isles) showed an increase of 42.9% in Median Price, and 40% in Average Sales Price. Zip Code 33304, which includes Fort Lauderdale Beach, the southern tip of Coral Ridge and the up and coming neighborhood of Poinsettia Heights, increased 30.3% in Median and 33.6% in Average Sale Price.
Check the Broward County City by City statistics, and the Broward County by Zip Code report to see more.
There is some interesting stuff:
Hillsboro Beach reported No Closed Sales, though last year their Median Price increased 46.4% to $18,295,000 based on a total of 6 Closed Sales, with Average Sale Price rising 14.4% to $15,800,000.
Lighthouse Point registered 178 Closed Sales, down 36.7% from 2021, with Median Price going up 26.4% to $1,388,888, and Average Sale Price increasing 25.4% to $1,823,269.
Lauderdale-by-the-Sea (or as we like to call it – Stoplights-by-the-Sea) reported 47 Closed Sales (down 17.5% from 2021), Median Price rising 57.7% to $1,222,500, Average Sale Price increasing 45.6% to $1,465,202.
Average Sale Price in the Town of Southwest Ranches shot up 47.4% to $2,240,290 on a total of 98 Closed Sales (down 37.6% from 2021). Median Price rose 30.2% to $1,482,500.
Condominiums and Townhomes
The Market for Condos and Townhomes showed similar resilience.
Statewide numbers report the Median Price for Condominium and Townhome properties rose 21.6% from $262,000 in 2021 to $306,500 in 2022. Average Sale Price increased from $382,963 to $445,305 year over year, representing a rise of 16.3%. Closed Sales were down 21.7% (from 160,177 in 2021 to 125,494 in 2022). Median Percentage of List Price Received went up to 99.9% from it's 2021 levels of 98.1%.
In the South Florida Metro Reporting Area (Miami-Dade, Broward and Palm Beach Counties) the Median Price of a Condo and Townhome increased 17% from $265,000 in 2021 to $310,00 in 2022. Average Sale Price was up 13.9% from $446,110 to $508,001 year over year. Closed Sales were down from 63,499 in 2021 to 51,232 in 2022, a decline of 19.3%. Median Percentage of Listing Price Received notched up from 96.7% to 98.5%.
In Broward County Median Price of a Condo and/or Townhome rose 14.9% from $271,500 to $250,000 year over year. Average Sale Price increased 20.9% from $296,632 in 2021 to $358,647 in 2022. Closed Sales went down from 21,858 in 2021 to 18,135 in 2022, a 17% decrease. Median Percentage of Listing Price Received rose from 2021's 96.9% to 99.1% in 2022.
Drilling down on the Condo numbers reveals some interesting stats.
In the city of Fort Lauderdale, Closed Sales declined 26.7% to 2,410, but the Average Sale Price shot up 39.1% to $784,049.
Further analysis reveals this increase is due largely to strong demand for the Beach.
Zip Code 33308, which includes the Galt Ocean Mile, showed a rise in the Average Sale Price of 31.8%.
Zip Code 33315 (encompassing South Lauderdale Beach, Harbor Beach and 17th Street Causeway) reported an increase of 37.8% in Average Sale Price.
And Zip Code 33304, which includes North Fort Lauderdale Beach, registered at increase in Average Sale Price of 71%.
2022 Year End Real Estate Market Reports
Click on buttons to download a pdf of statistical reports.
Florida 2022 Statewide Single Family
Florida 2022 Statewide Condos
Florida 2022 Statewide Metro Areas
South Florida 2022 Single Family
South Florida 2022 Condos
Broward County 2022 Single Family
Broward County 2022 Condos
Broward County Single Family City by City 2022
Broward County Condos City by City 2022
Broward County Single Family by Zip Code 2022
Broward County Condos by Zip Code 2022
Some Charts you might find interesting
The Latest S&P Case-Shiller Home Price Index
South Florida Metro – Miami-Dade, Broward and Palm Beach Counties

Blue Line is South Florida HPI
Dotted Line is the Home Price Index for the U.S.
Shaded Areas on Chart represent U.S. Recessions
Since The Pandemic
S&P Case-Shiller Home Price Index – South Florida Metro
from 2019 through May 2023
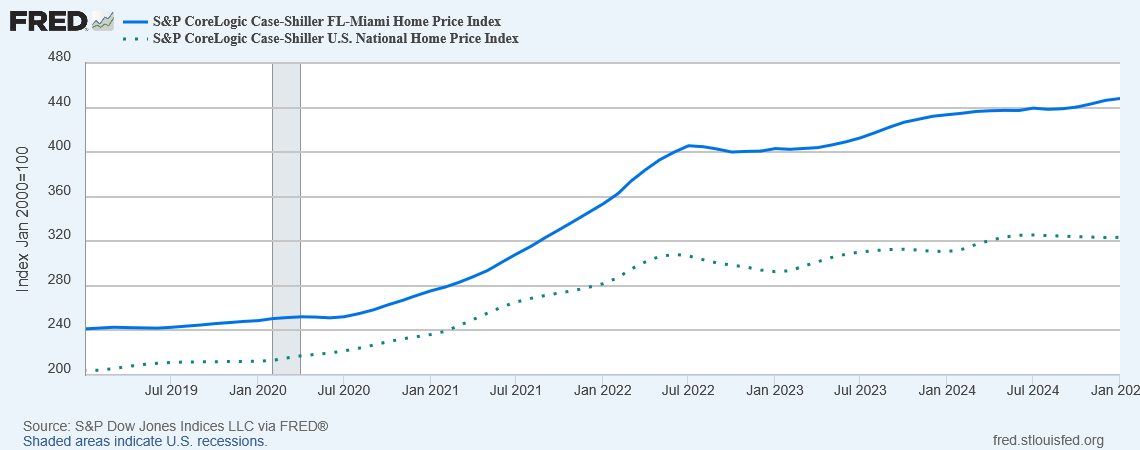
South Florida (Blue) versus U.S. (dotted)
Real Estate Taxes
Run Cursor over map to see where each State ranks.
Total Tax Burden by State
Run Cursor over map to see where each State ranks.
In-Depth Analysis & Projections
Home Price Appreciation in Fort Lauderdale Inevitable
As a professional full-time realtor I pay a lot of attention to housing statistics. Not justsomehousing statistics.ALLthe statistics. Sherlock Holmes used to say: "Always fit the theory to the facts, not the facts to the theory." CoreLogic, RealtyTrac, S&P / Case Shiller, the National Association of Realtors and the Florida Association of Realtors all release real estate market reports on a monthly basis. Yet, I read articles where people seize upon selected data supporting their position, neglect to consider all the facts.
I don't know if there is any place this has cost people more money than around Fort Lauderdale and South Florida. We have a unique market. It is highly shopped, extremely active, dynamic.
Over the past few months and years some very interesting statistics have emerged. Taken individually these numbers are all compelling on their own, but when you add them all together I think they paint a pretty clear picture of what's in store for the Fort Lauderdale real sstate market moving forward.
1. Not Making Any More
It's usually recited about beach front property, but there's an old Real Estate Adage: "They're not making any more of it."
That has never been truer than it is in Fort Lauderdale, the primo location in the state of Florida. There is only so much land. Broward County is not large to begin with, approximately 27 miles north and south, perhaps 45 miles east to west. However, around 60% of this geographic area are wetlands which cannot be developed without cutting off their own water supply. They can no longer build any anything else beyond the Sawgrass Expressway and US-27, which are somewhere between 10 and 15 miles from the coast. So the entire county is 1,320 square miles with 115 square miles of water. Boil it all down this leaves only 471 square miles of developable dry land.

At this point this developable land is now 99.99% developed. There are no more swaths of scrub forest east of US-27 and the Sawgrass which can be bull-dozed into housing projects. Drive the Sawgrass Expressway through northern Broward you see housing developments and commercial properties along the east side of the road, and along the west side of the highway it is literally The Everglades – whip grass, wading birds and alligators.

2. Come On Down
Recently Florida surpassed New York as the third most populous state in the nation. Well, you never have to shovel sunshine off your driveway. Admittedly the population is increasing rapidly through Central Florida, but Broward County is arguably the most desirable part of the state. In 1960 they took the Census, there were 60,000 residents. Ten years later in 1970 there were 600,000. Currently the population is around 1.75 million and projected to climb to almost 2.3 million by the year 2020.
That's 550,000 more people – or an additional 31.4% – moving into the same 471 square miles of dry land.
That's an additional 1,167 people per square mile, with the current density being 3,715 residents per square mile.
3. Location, Location, Location
In addition to geographic limitations and population growth projections we also took note of some intruiging statistics compiled by the Florida Association of Realtors concerning the continued rise in the median price for both single family homes and condominiums.
Below are links to Year End Summary Reports for sales of single family homes and condos across the state. Click on the images if you wish to see these reports, but I can save you the trouble. They show the median price increased 15.9% year over year in single family, and 20.1% for townhomes and condos.
Closer analysis of these numbers confirms an assertion I have been telling my customers for the last couple years – that better properties will outperform the statewide average.
This is illustrated in the report below: Florida Residential Market Sales Activity, Statewide by Metropolitan Statistical Area.
In the reporting area of Miami, Fort Lauderdale and Pompano, Median Price for Single Family Homes rose 20.3% year to year, 26.2% in condos and townhomes, versus the statewide average above, 15.9% in single family, 20.1% for townhomes and condos).
These numbers are still a bit skewed, however, for companies that compile these statistics use a very large reporting area for South Florida, typically encompassing all of Miami-Dade, Broward and Palm Beach Counties. Were you to distill these stats down to Broward County, the better location within that reporting area, the numbers would undoubtedly increase. And if we could isolate the east side of Fort Lauderdale, they'd go up even higher.
4. Connect The Dots
Talk about a No Brainer, this would seem to be a simple matter of connecting the dots, what this should mean for property values in Fort Lauderdale and throughout Broward County. 1) We don't have much land. 2) Population is growing. 3) Demand is increasing. And 4) Prime property will outperform the overall average.
Add these factors up significant appreciation in property values seems relatively inevitable. In addition, whatever rate of appreciation you might wish to forecast for the overall county-wide average, it shall be markedly greater in prime real estate – waterfont homes, oceanfront condos, houses and townhomes in nice nieghborhoods along the coast.
In My Professional Opinion
We are looking at a pretty good stretch into the foreseeable future, barring Acts of God, asteroid impacts and/or the total collapse of Western Civilization. Bouncing off the bottom real estate values jumped across South Florida, increasing almost 30% through 2012-13. People were talking about another bubble, but the market consolidated through 2015, then got back on track in 2014. Meantime, depending upon which market reports you are quoting, property values have increased for the last 40-50 consecutive months. The most current reports project 2016 shall mark a return to normalcy nationwide, but a "normal" market in South Florida real estate typically means annual appreciation of 8-10%.
If 8-10% annual appreciation in an active market which will allow you to sell your property and take your profit isn't good enough for you – good luck and God bless.
In 2010 I told my customers to start buying. The housing market in Fort Lauderdale had stabilized, had started inching upward. I told customers as soon as real estate investors noticed prices going up in South Florida we'd have a mini land rush. Well, I was right. Customers who listened have already seen great appreciation. Others started citing stuff they were reading on the Internet about the "Shadow Inventory" – this mythical tidal wave of impending foreclosures that was going to swamp our market like a tsunami. Now those people are sitting in a little rubber raft on the beach in their rain slickers and their floppy hats, waiting for the big wave. Meanwhile, people who listenend are lounging on the balcony of their luxury oceanfront residence sipping mojitos and laughing at those crackpots in the rubber rafts, wondering what we pay the Police for anyway.
Explosive Long Term Growth
Much has been made of the volatility of the South Florida Real Estate market, especially in the past few years, but I think it's important to put this all in proper historical context.
The best indicator of this may be the Standard & Poor's / Case-Shiller Home Price Index. This highly regarded index tracks the values of the same houses over time. Some analysts argue that's a better measure than the median price.
Below is the most recent chart tracking home values in the reporting area of Miami-Dade, Broward and Palm Beach Counties versus the (green line) U.S. average.

I don't think I've ever seen the strength of the South Florida Real Estate market more graphically illustrated.
First thing that hits you, of course, is that big spike, how crazy the market must've been from 2003 to 2005 – that sharp up-tick and that steep decline. It happened on a national level as well, just not as dramatically. Even so, remember that spike represents a bunch of money that was made. Many people lost it all, and then some, pouring it back into the market, but that's on them. It does not change the fact that big profits were made.
Perhaps most fascinating, however, is the long term overall trend. Look at this second chart below where I have added the blue trend line, following the overall upward trend of home prices in South Florida dating back to the mid-70s. Home prices went crazy from 2003 to 2005, shot up and then plummeted, but in the end price levels still wound up a little higher than they probably whould've been given their historical upward climb.
Particularly impressive is what the South Florida market has done since 2011 or so. Not only has it risen faster than the overall trend, but if you consult the first chart above you will see our property values have risen much faster than the national average.

Appreciation All But Inevitable
As previously stated, taking all these factors into consideration I feel that buying property in South Florida, especially Fort Lauderdale, is pretty much a No-Brainer.
South Florida Real Estate has always followed a boom and bust cycle. Fortunes have been made here. As long as we've got the Atlantic Ocean and the Gulfstream, palm trees gently swaying in tropical Trade Winds off a turquoise ocean – and heaters we only use two weeks of the year – significant appreciation of home values is relatively inevitable.
Some years ago I got into my car, found the carpet and floor mats soaked. Took it into the shop. The mechanic told me the water had sat in my car heater so long without circulating it had rusted right through the pipes.
Where else in the country is that going to happen?
So buy now or forever hold your "piece" – of Cleveland, Newark or Detroit.
Research Florida Real Estate Statistics
Click Button below, go the Research & Statistics Page
of the Florida Association of Realtors.
Florida Market Reports
Many Reports are Publicly Available. Some are Members Only.
Should you be interested in a report which is only available to Association Members,
feel free to give me a call. I'll be happy to download one for you.
It's not like this stuff is Top Secret or anything.
Coming Soon Listings
Not Active on MLS Yet
Before they appear on big Real Estate sites
Click Button Below
Sneak Previews
Get A Head Start
On Your Home Search

5 Star Rated Realtor
Internet Marketing Expert
Click This Button to See
What Clients Say
About Jim Esposito
LIST YOUR HOME
with
The Best Realtor in Ft. Lauderdale
Click The Button Below to Receive a Complimentary
Property Evaluation
Of the Market Value of Your Home!
Before You List
You Should Read
10 Tips to Boost Home Value
Real Estate Pros Share Valuable Insights How To Get The Most for Your Home
Increase Home Value
Fort Lauderdale Beach Webcam
Click Image See Live Webcam
Ft Lauderdale Home Value
ANALYSIS & PROJECTIONS
Real Estate Projections
A Comprehensive and Intelligent Consideration of What's Ahead For The Local Real Estate Market
FREE MLS ACCOUNT
Save Listings
Saved Searches
Email Alerts & Updates
Client Log In
Registration Required
Most Recent Real Estate Statisics
Fort Lauderdale, Broward County, South Florida, Statewide & Beyond
Just The Facts
Latest Statistics
Home Buyer Assistance
Programs Offered
by Broward County
& The State of Florida
Make It More Affordable
to Buy A House
Find Out More!
Homebuyer Programs
Sitio en Español
Site en Français
Site em Português
Seite auf Deutsch


CEOs & Founders
of
For Sale By Owner
Buy Owner
Craigslist
ListTHEIRHomes
with
Realtors!
Read About It Here
Like – I Know What I Say, But Now We're Talking
MYMONEY!


